Using the Ratio Analysis
The Ratio Analysis document consists of an extensive list of financial and non-financial performance ratios to provide a better understanding on the organization financial position. The ratios are calculated automatically based on your Working Papers data.
- Selecting the ratios required
- Specifying Global Setup Options
- Inserting rows, header rows and page breaks
- Linking Cells from Excel
Selecting the Ratios Required
Procedure
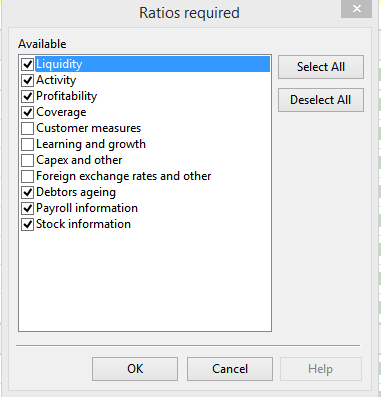
- When opening the Ratio Analysis document for the first time, the Entity Information tab will automatically appear so that you can select the applicable ratio categories to display.
-
Click Ratios required and select the applicable ratio categories you would like to display in your report.
Results
The selected ratios categories are displayed.
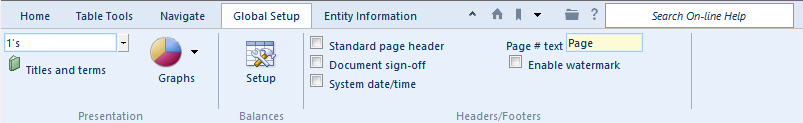
Specifying Global Setup Options
In the Global Setup tab, you can define default settings to apply to the Ratio Analysis document.
Rounding
-
From the Rounding drop-down, select the rounding to use.
Option Description 1 Do not round numeric values. 1,000's Round numeric values to the nearest thousand. 1,000,000's Round numeric values to the nearest million. -
The Rounding Terminology & Display dialog automatically appears. You can choose where to display the rounding information in the report or column header and select the number of decimal places to display. Note: Clicking the
 Titles and terms button in the tab launches the same dialog.
Graphs
The ratio analysis document can generate a visual graph depiction of each ratio.
- Click Graphs and select to display a Pie or Bar graph below each ratio.
Balances Setup
- Click Balances Setup to open the Balance Setup dialog.
- For financial ratios, specify the balances (actual or budget) to be used in the ratio calculation and also specify which periods should be as a comparative period.
- For non-financial performance measures, specify whether to display the performance measure as a dollar value or a percentage and specify which periods should be used as the comparative periods.
Headers and Footers
Select from the available options to configure the header and footer:
| Option | Description |
| Standard Page Header | Prints the page header on each page. |
| Document Sign off |
Prints a completed by and reviewed by table on each page.
|
| System date/time | Prints your computer's time and date in the footer. |
| Page #text | Prints the specified page number text that displays before the page number. |
| Enable Watermark | Prints a draft watermark sign. |
Inserting Rows, Header Rows and Page Breaks
You can insert additional custom ratio rows, numeric rows, header rows and page breaks.
Procedure
- Click in the table where you want to add.
-
From the Table Tools tab, in the Operations group, click
 (Insert) drop-down and select one of the following:
Option Description Rows Insert rows into any ratio table. Header rows Insert header rows into any ratio table. Ratio Rows Insert a row that displays the result as a ratio. Numeric Rows Insert a row that displays the result as a numeric value.
Graph Inserts a graph for the newly added row. Page Break Inserts a page break before the table.
Linking Cells from Excel
You can link Excel cells from Excel documents added to Working Papers Document Manager.
Procedure
- Click on a row where you want to link cell values from Excel. Note: Linkable rows are denoted with an
 icon to the left of the row.
 - From the Table Tools tab, in the Operations group, click Link from Excel.
- The CaseView Excel Linkage dialog appears. Select the applicable Excel document from the Document Manager and then select the worksheet and the cell range.
Results
Cells in the row are now linked to the specified cell range from the Excel document.