Ratio Index
For more information on Working Papers Ratio Classes, please see the Ratio Class List.
To navigate, select a ratio from the following list:
Liquidity Ratios
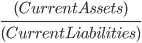
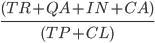
L1 - Current Ratio
Measures a company’s short-term liquidity and its ability to meet current obligations when due. The higher the ratio, the greater the "cushion" between current obligations and the company’s ability to pay them.
Formula
Formula as Working Papers Ratio Classes
L2 - Working Capital
Measures the excess of current assets over current liabilities. It denotes the amount of assets expected to be converted to cash or consumed within one year beyond those used to pay current obligations. The amount is useful in performing a trend analysis on the company.
Formula

Formula as Working Papers Ratio Classes

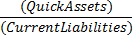
L3 - Quick Ratio
Measures the degree to which current obligations are covered by the most liquid current assets. Usually a value less than two implies a dependency on inventory or other current assets to liquidate short-term debt. Also known as the Acid-Test.
Formula
Formula as Working Papers Ratio Classes

L4 - Defensive Interval Days
Measures the length of time a company can operate on present liquid assets without resorting to revenues from next year’s sources.
Formula
Formula as Working Papers Ratio Classes
L5 - Altman Z Score
A numerical ranking that predicts the bankruptcy potential of a company. Z-scores below the threshold value of 2.6 indicate that the overall financial condition of a company is such that continued existence may be in question. Z-scores below 1.8 indicate that there is a strong potential for bankruptcy within the next two years.
Formula
Formula as Working Papers Ratio Classes
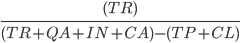
L6 - Accounts Receivable to Working Capital
Measures the dependency of working capital on the collection of receivables.
Formula
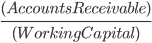
Formula as Working Papers Ratio Classes
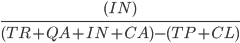
L7 - Inventory to Working Capital
Measures the dependence of working capital on inventory and sales. A high inventory to working capital ratio means that a slump in sales could create serious cash flow problems.
Formula
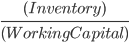
Formula as Working Papers Ratio Classes
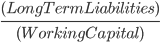
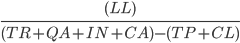
L8 - Long Term Liabilities to Working Capital
In conjunction with other ratios, this ratio measures the degree to which long-term borrowings have been used to replenish working capital versus fixed asset acquisition. A high ratio may indicate that the company has reached its borrowing limit and should look toward equity financing. A low ratio may indicate an opportunity to convert short-term into long-term borrowing during periods of favorable interest rates.
Formula
Formula as Working Papers Ratio Classes
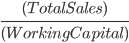
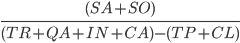
L9 - Sales to Working Capital
In conjunction with the Inventory to Working Capital Ratio, this ratio indicates the degree to which working capital is dependent on sales.
Formula
Formula as Working Papers Ratio Classes
Activity Ratios
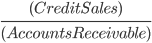
A1 - Accounts Receivable Turnover
Measures the number of times trade receivables turn over during the year. The higher the turnover, the shorter the time between sale and cash collection.
Formula
Formula as Working Papers Ratio Classes

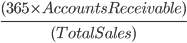
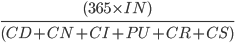
A2 - Days Sales in Receivables
Measures the average length of time receivables are outstanding. Helps determine if potential collection problems exist.
Formula
Formula as Working Papers Ratio Classes

A3 - Inventory Turnover
Measures the number of times inventory turns over during the year. High turnover can indicate better liquidity or superior merchandising. Conversely, it can indicate a shortage of needed inventory for the level of sales. Low turnover can indicate poor liquidity, overstocking, or obsolescence.
Formula

Formula as Working Papers Ratio Classes
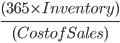
A4 - Days Cost of Sales in Inventory
Measures the average length of time units are in inventory. Helps determine if inadequate or excess inventory levels exist.
Formula
Formula as Working Papers Ratio Classes
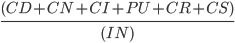
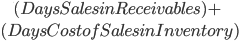
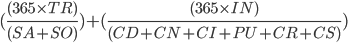
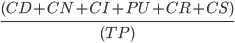
A5 - Operating Cycle Days
Measures the time it takes to convert products and services into cash. An unfavorable trend may be a leading indicator of future cash flow problems.
Formula
Formula as Working Papers Ratio Classes
A6 - Accounts Payable Turnover
Measures the number of times accounts payable are converted to cash each year.
Formula
Formula as Working Papers Ratio Classes
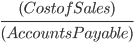
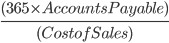
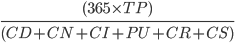
A7 - Days Cost of Sales in Payables
Measures the average age of accounts payable and indicates the bill-paying pattern of the company.
Formula
Formula as Working Papers Ratio Classes
A8 - Asset Turnover
Measures the efficiency with which the company is able to use its assets to generate sales. The higher the turnover, the more efficiently its assets have been used.
Formula

Formula as Working Papers Ratio Classes
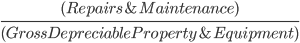
A9 - Repairs & Maintenance to Gross Depreciable Property & Equipment
Expresses the relationship of repairs and maintenance to gross property and equipment. Percentages outside of normal ranges could indicate classification errors in amounts capitalized. High percentages can indicate older property and equipment with needs replacement.
Formula
Formula as Working Papers Ratio Classes

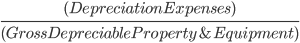
A10 - Depreciation Expense to Gross Depreciable Property & Equipment
Measures the rate at which productive asset costs are allocated to operations.
Formula
Formula as Working Papers Ratio Classes

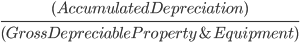
A11 - Accumulated Depreciation to Gross Depreciable Property & Equipment
Shows the cumulative percentage of productive asset costs allocated to operations. A high percentage usually indicates older property and equipment. Significant capital investment may be required in future periods
Formula
Formula as Working Papers Ratio Classes

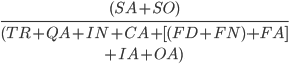
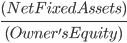
A12 - Net Property & Equipment to Owner's Equity
Measures the extent to which investors’ capital was used to finance productive assets. If this ratio is below 1, owners’ investment may not have been used to generate future profits.
Formula
Formula as Working Papers Ratio Classes
Profitability Ratios
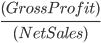
P1 - Gross Profit Margin
Indicates how much of each sales currency is available to cover operating expense and contribute to profit.
Formula
Formula as Working Papers Ratio Classes
P2 - Net Profit Margin
Measures how much of each currency of sales was converted to profit.
Formula

Formula as Working Papers Ratio Classes
P3 - Return on Asset
Measures the ability to generate profits by additional investment in productive assets.
Formula

Formula as Working Papers Ratio Classes
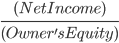
P4 - Return on Investment
Measures each sales currency’s benefits to owners.
Formula
Formula as Working Papers Ratio Classes
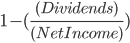
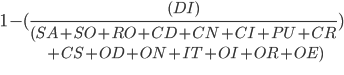
P5 - Retention Ratios
Measures the percentage of net income retained for future growth and expansion. Affects cash flow and future growth potential.
Formula
Formula as Working Papers Ratio Classes
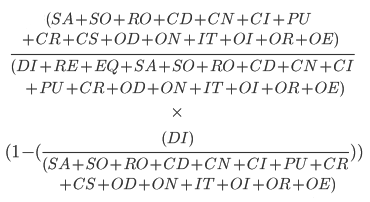
P6 - Potential Growth Ratio
Computes maximum future growth rate based on current results.
Formula

Formula as Working Papers Ratio Classes
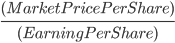
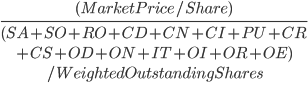
P7 - Price Earnings Ratio
This ratio is not directly controllable by management, but is important to investors and can have a big impact on future financing needs and alternates. A stable trend in net income generally results in a higher price earnings ratio.
Formula
Formula as Working Papers Ratio Classes
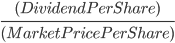
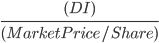
P8 - Dividend Yield
Measures the cash flow return to investors, based upon the dividend declared against the cost of the investment as indicated by the market price per share.
Formula
Formula as Working Papers Ratio Classes
Coverage Ratios
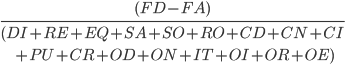
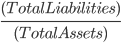
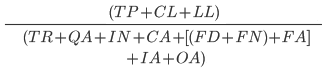
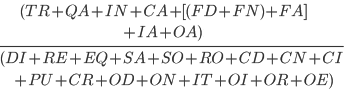
C1 - Debt Ratio
Measures the portion of total assets provided by the company’s creditors. In conjunction with other ratios, this ratio indicates the degree to which operating losses may be "cushioned" from adverse actions by creditors.
Formula
Formula as Working Papers Ratio Classes
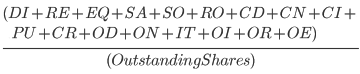
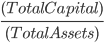
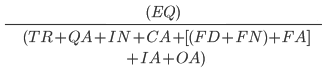
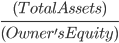
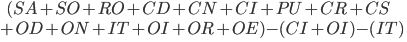
C2 - Owner's Equity
Measures the portion of total assets provided by the company’s investors. In conjunction with other ratios, this ratio indicates the degree to which operating losses may be "cushioned" from adverse actions by investors.
Formula
Formula as Working Papers Ratio Classes
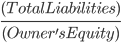
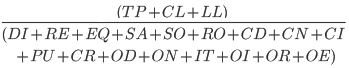
C3 - Debt to Equity Ratio
Formula
Formula as Working Papers Ratio Classes
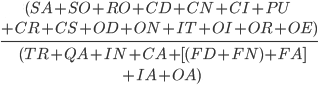
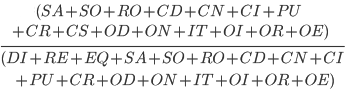
C4 - Financial Leverage Index
Indicates the extent to which the owners have leveraged their investments. This is the reason for the difference between the return on assets ratio and the return on equity ratio.
Formula
Formula as Working Papers Ratio Classes
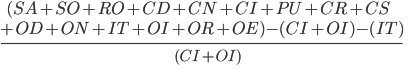
C5 - Earnings Before Interest
Measures the operating profit of a company before the effects of financing costs and income taxes. This is a meaningful indicator that has comparability with other companies because it excludes the effects of capitalization (i.e. debt and equity financing).
Formula

Formula as Working Papers Ratio Classes
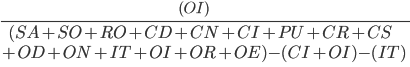
C6 - Times Interest Earned
Measures the company’s ability to pay its contractual interest payments. Also indicates the extent to which financial leverage had a positive or negative effect on net income.
Formula
Formula as Working Papers Ratio Classes
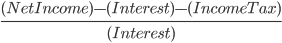
C7 - Interest to Net Income before Interest
Measures the effect of leverage on net income.
Formula
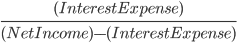
Formula as Working Papers Ratio Classes
C8 - Book Value per Share
Reflects value per share available to owners based on historical costs. Does not reflect the effect of inflation.
Formula
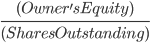
Formula as Working Papers Ratio Classes