Display graphs
You can display a graphical overview of the data in your Leadsheet/Grouping automatic documents using the Graphs view (View | Graphs). These overviews show the total balance of current and prior years for easy comparison.
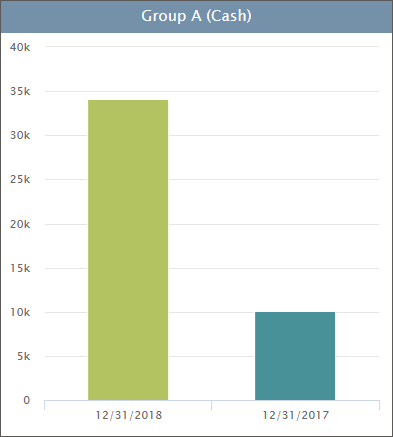
By customizing the period, balance type, and balances in the automatic document properties, you can change the information that displays in the graph. Hover your cursor over data in the graph to view the individual values.
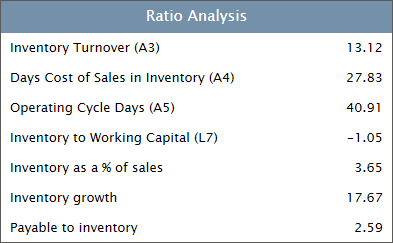
When a ratio class is assigned to the map or group number, relevant ratios are displayed as a Ratio Analysis graph for comparison to the current and prior balances.
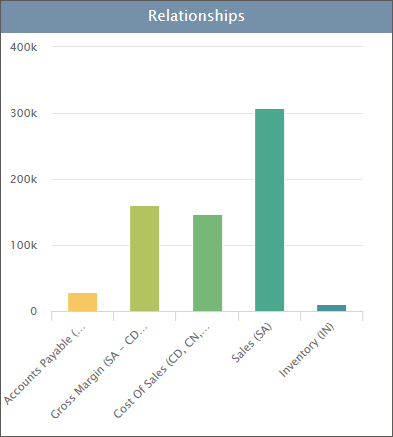
When assigned, some ratio classes also support a Relationship graph, which compares the values of related accounts.
Notes:
- Leadsheets set to Active/Preceding Period or User Defined balance types are not supported.
- Graphs and ratios will print with the Leadsheet if the Graphs view is enabled.
![]()
Visit us: www.caseware.com | Follow us: 


© 2021 CaseWare International Inc. | Privacy | Terms of Use | Trademarks